Wednesday, August 12th - MLB Matchup Graphs
The following article goes over a few of today's MLB matchups.

Richay
MLB & NFL

MLB MATCH UP PREVIEWS
The following article goes over a few of today's MLB matchups.
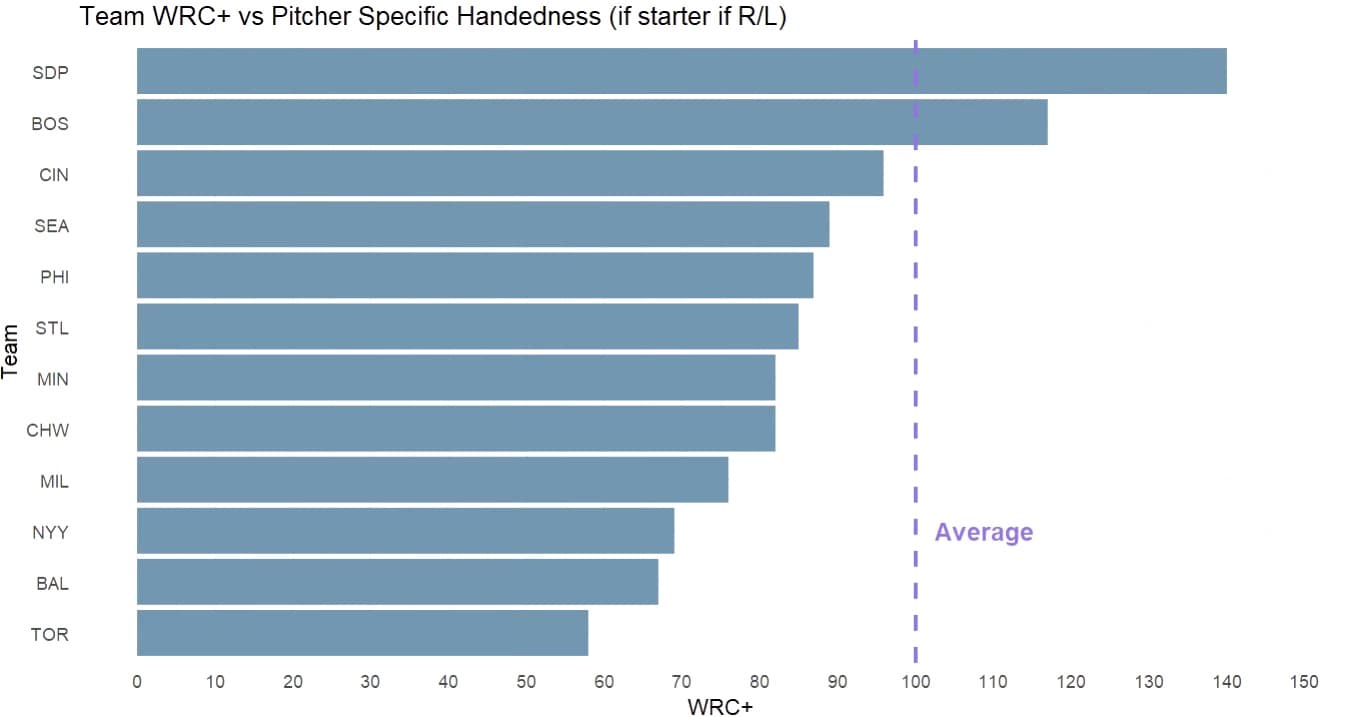
These graphs are made to help simplify the matchups for today and help you make some bets. What does all of this data even mean? I break it down below. Note there is overlap from the trade deadline, but these are still pretty good indicators.
TEAM STATS ARE FROM POST ALL-STAR BREAK TO AUGUST 7TH.
WHAT IS WRC +? INTERPRETATION IS HIGHER VALUES =GREATER RUN LIKELIHOOD. 100 IS THE LEAGUE AVERAGE. THESE ARE BASED ON THE TEAM STATS VS RHP OR LHP, BASED ON WHO THE STARTER IS.
PITCHER DATA ARE BASED ON PERFORMANCE THROUGHOUT THE YEAR.
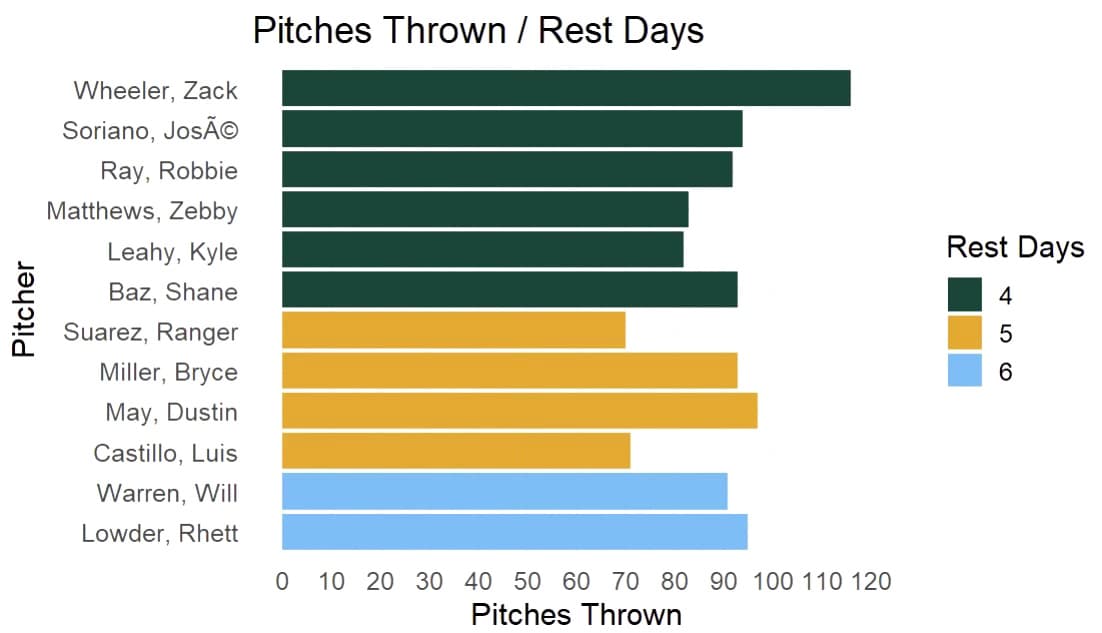
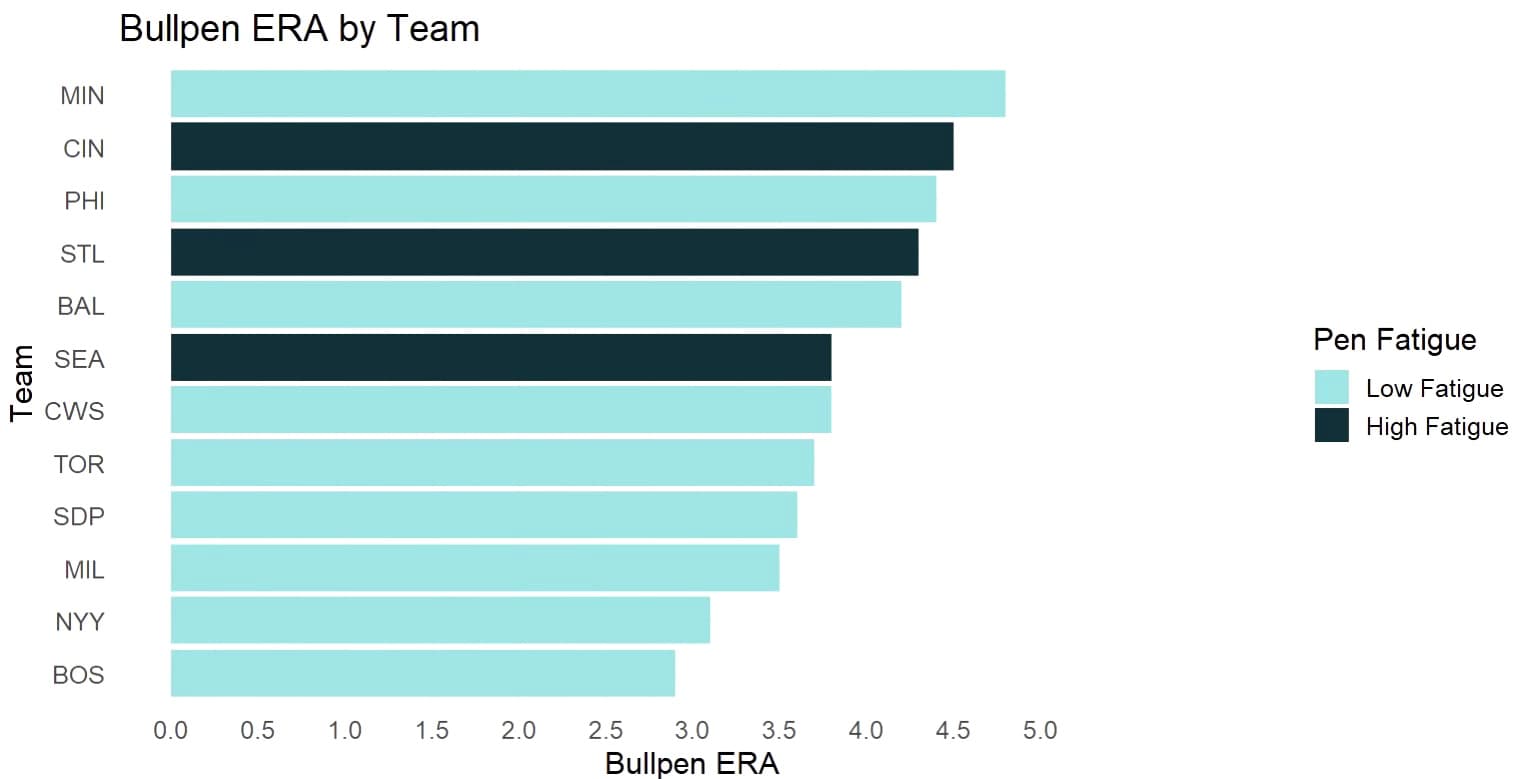
BULLPEN DATA UPDATED DAILY.
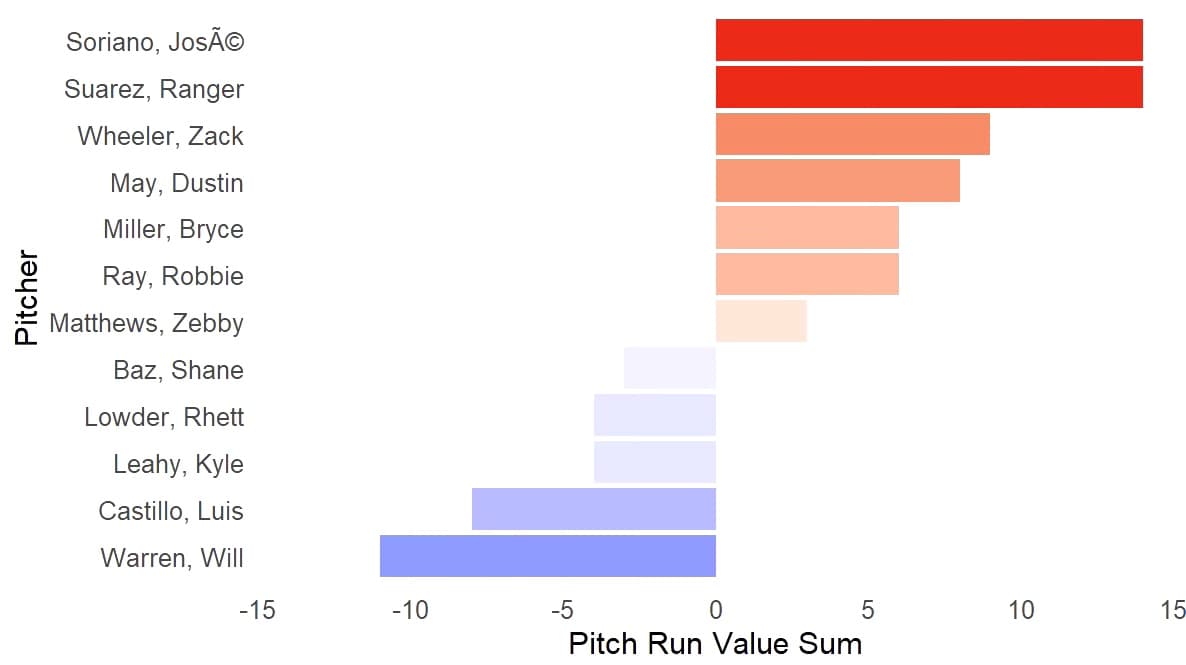
PITCHER RUN VALUES ARE THE SUM OF THAT PITCHER'S MOST COMMON PITCHES. HIGHER NUMBERS MEAN A BETTER GRADED CUMULATIVE PITCH MIX. LOWER NUMBERS MEAN WORSE GRADED CUMULATIVE PITCH MIXES.
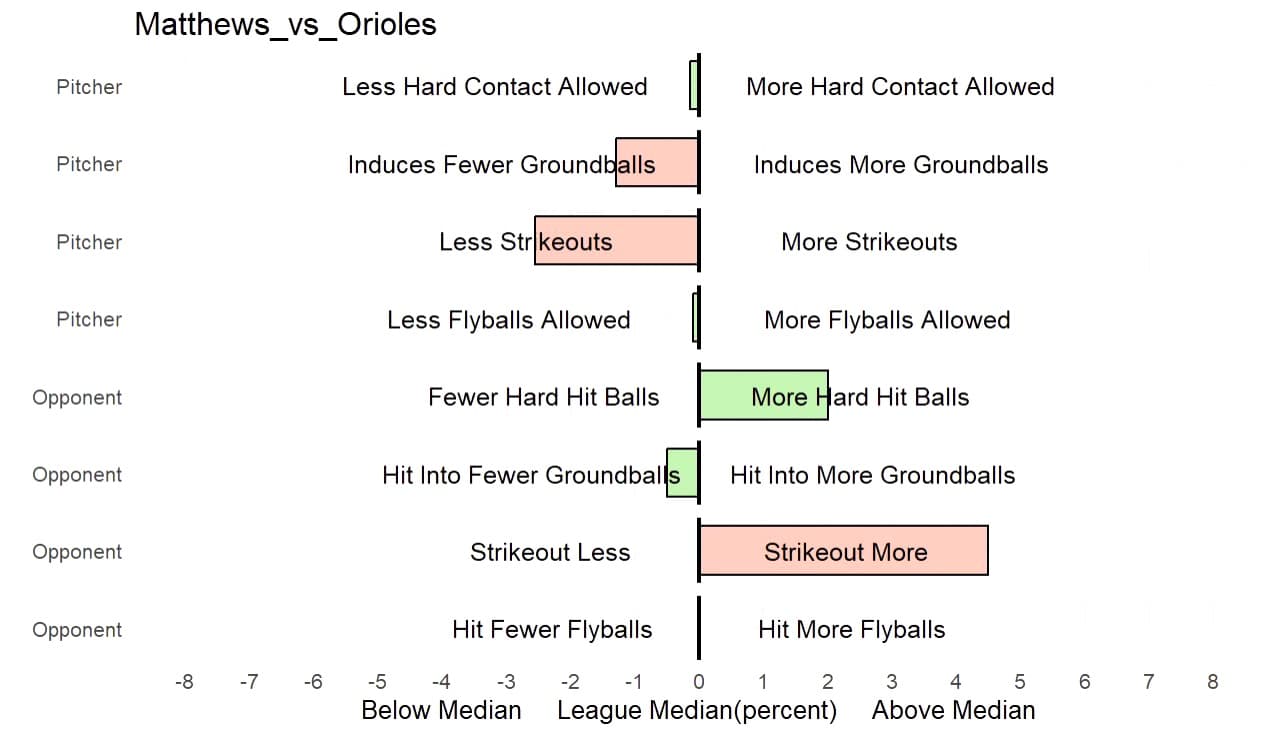
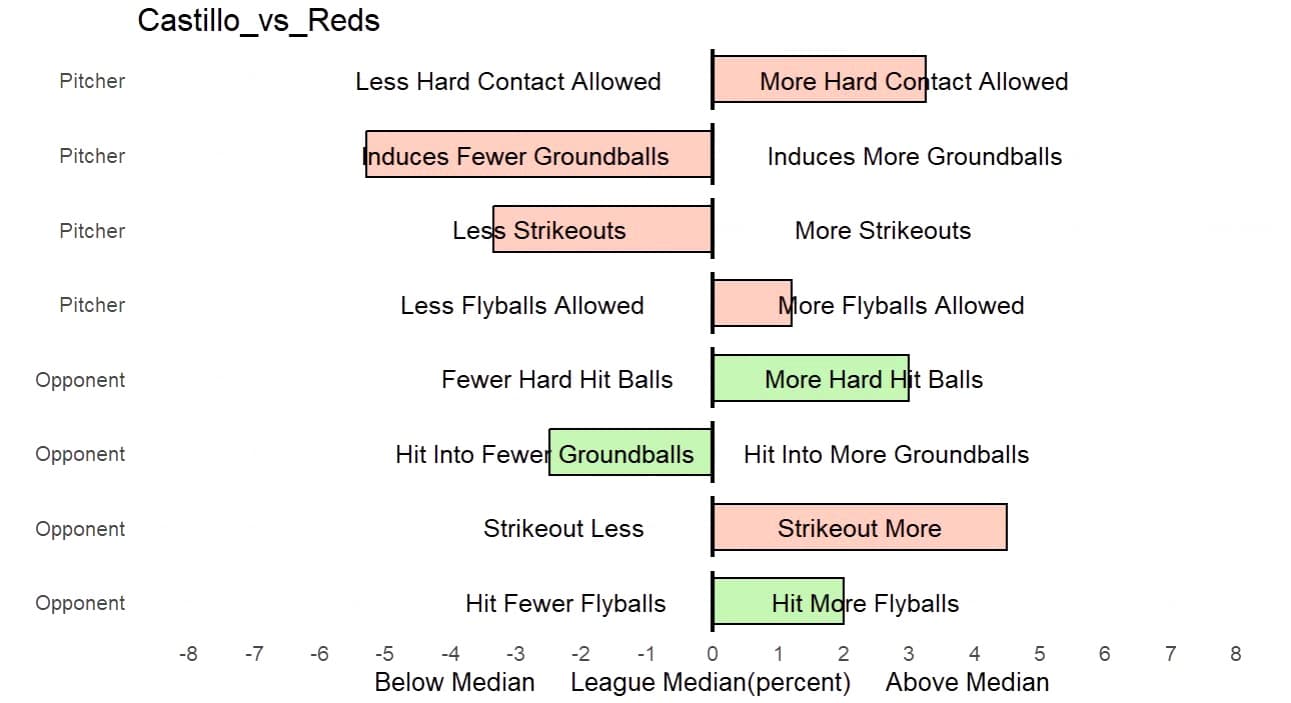
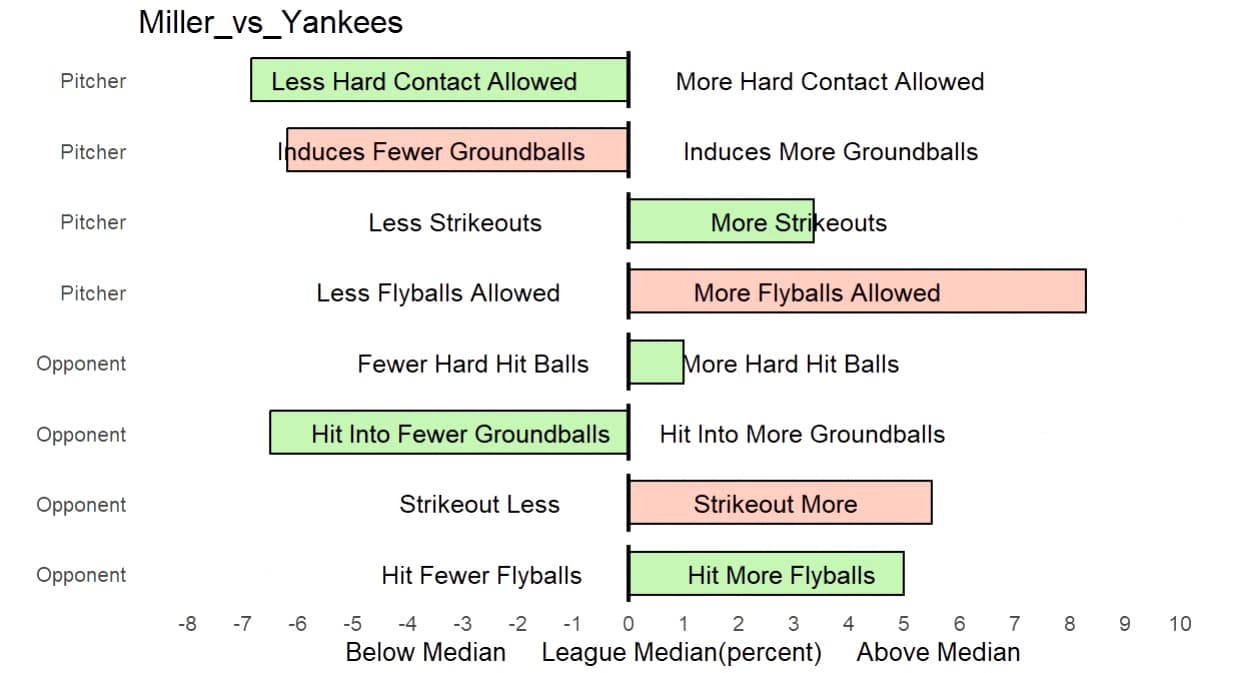
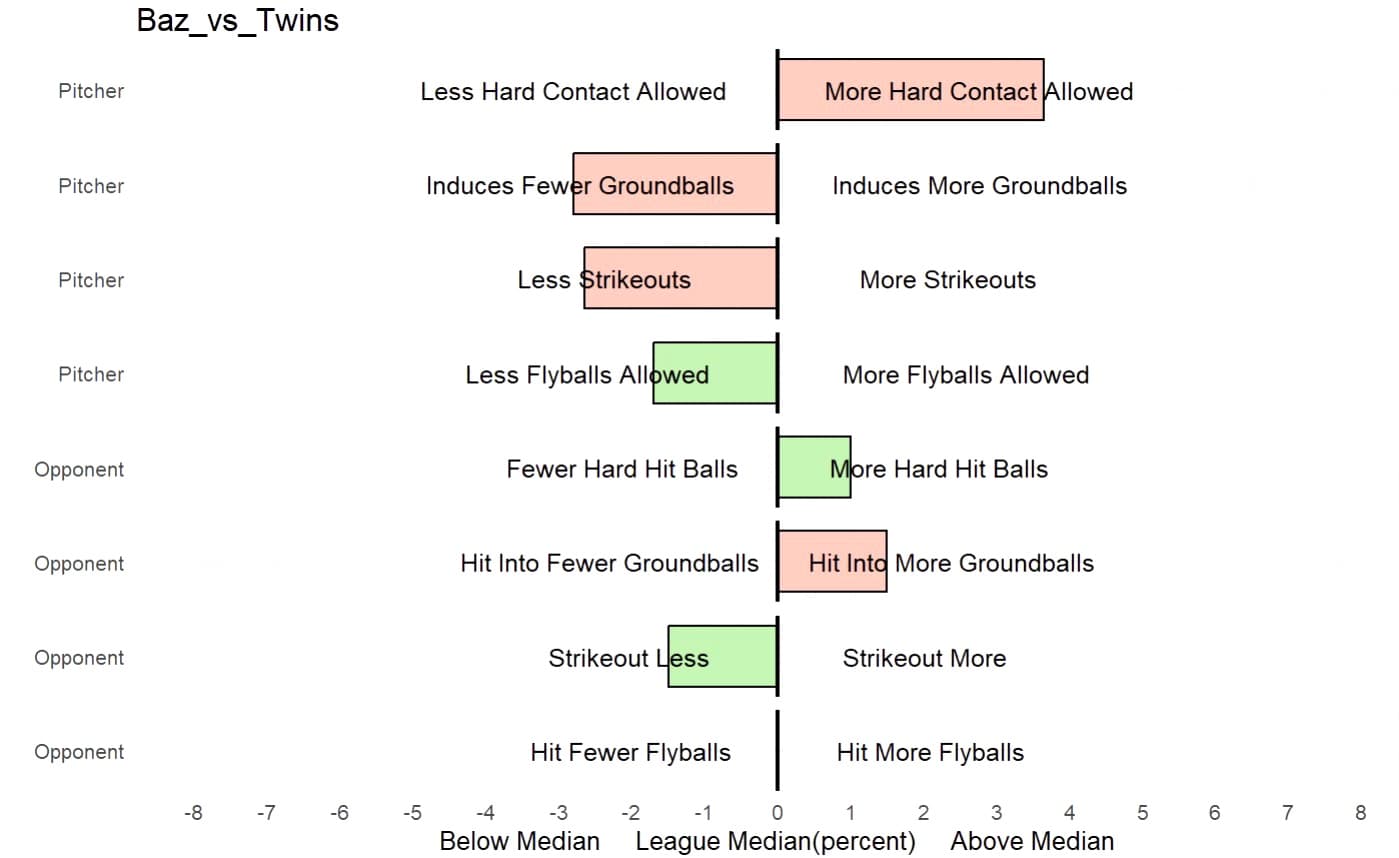
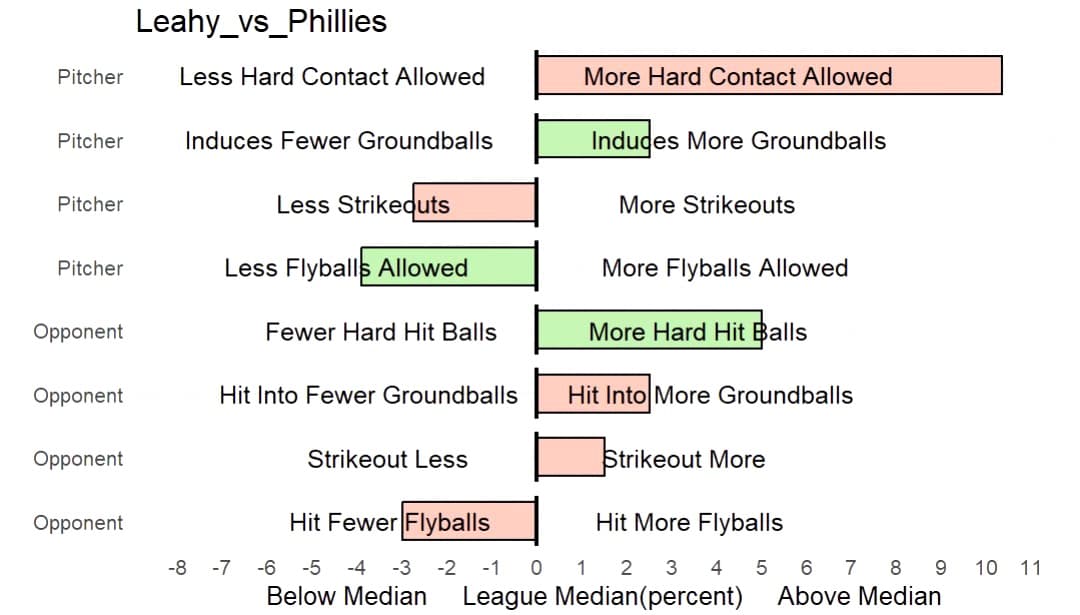
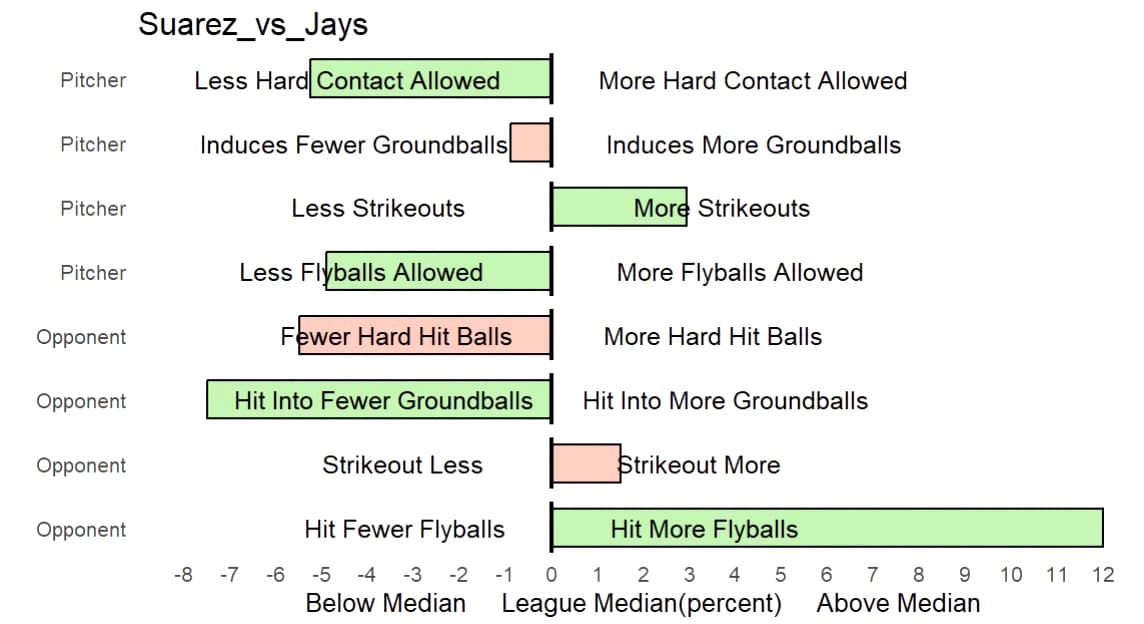
GRAPH EXAMPLE INTERPRETATION
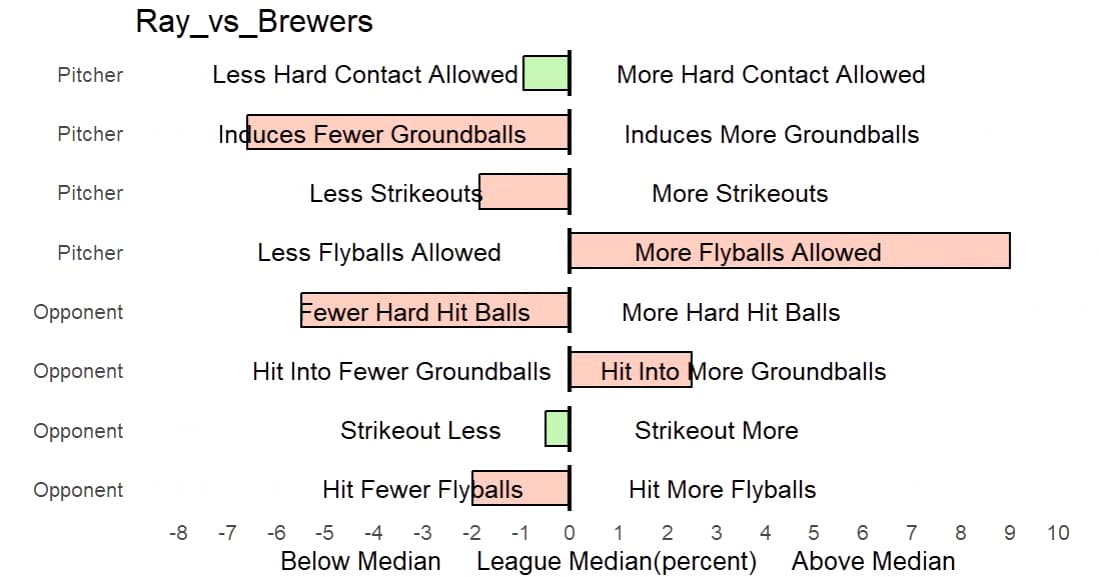
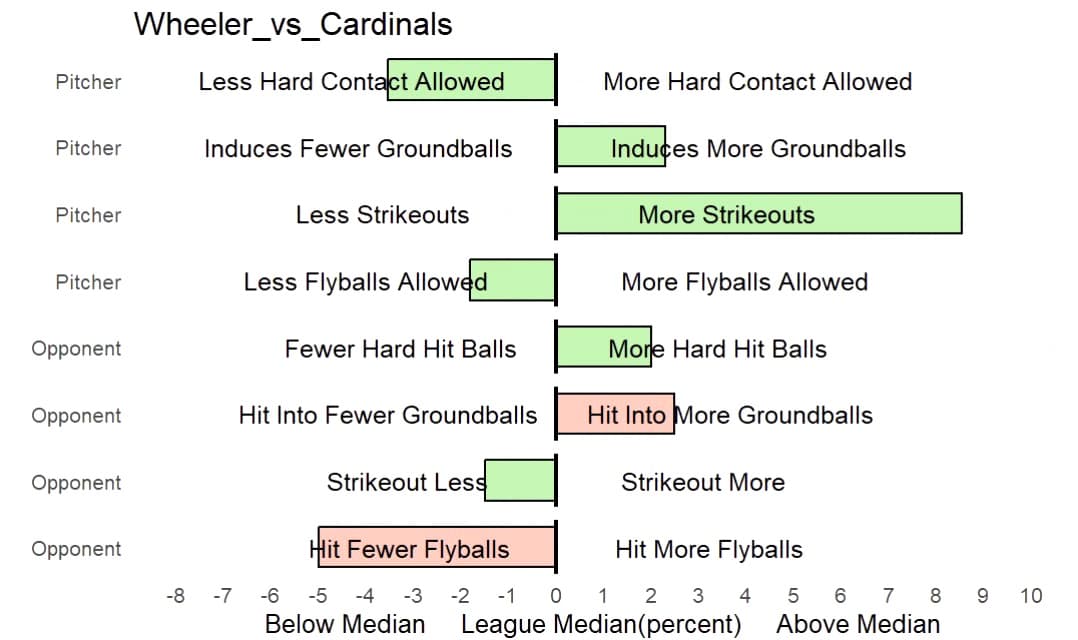
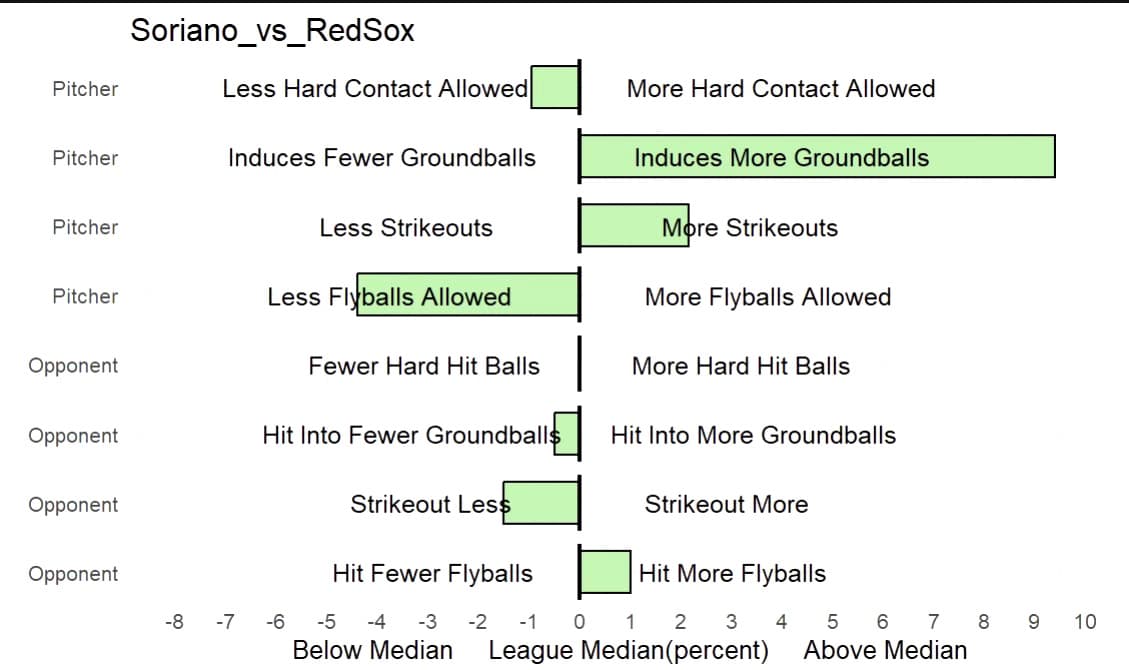
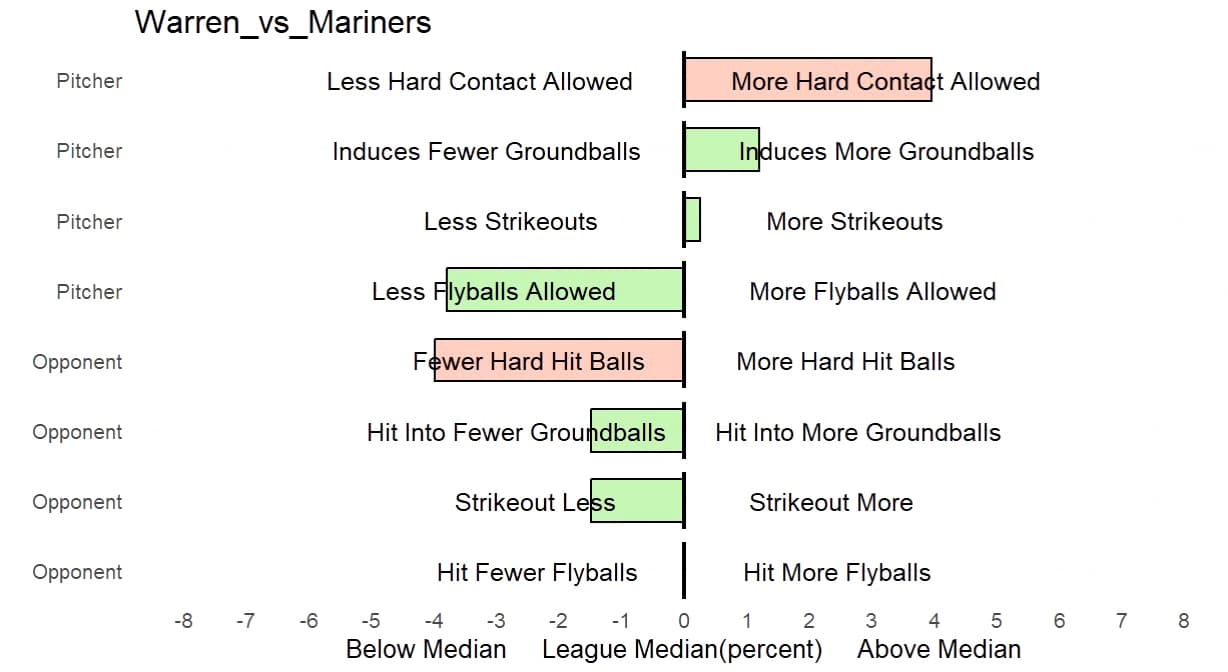
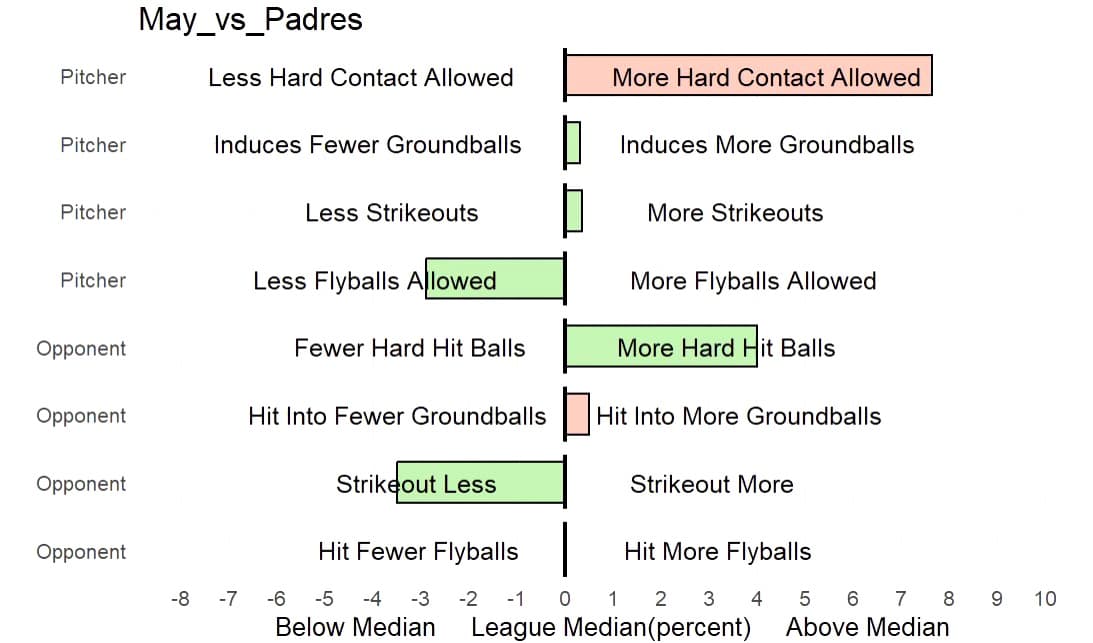
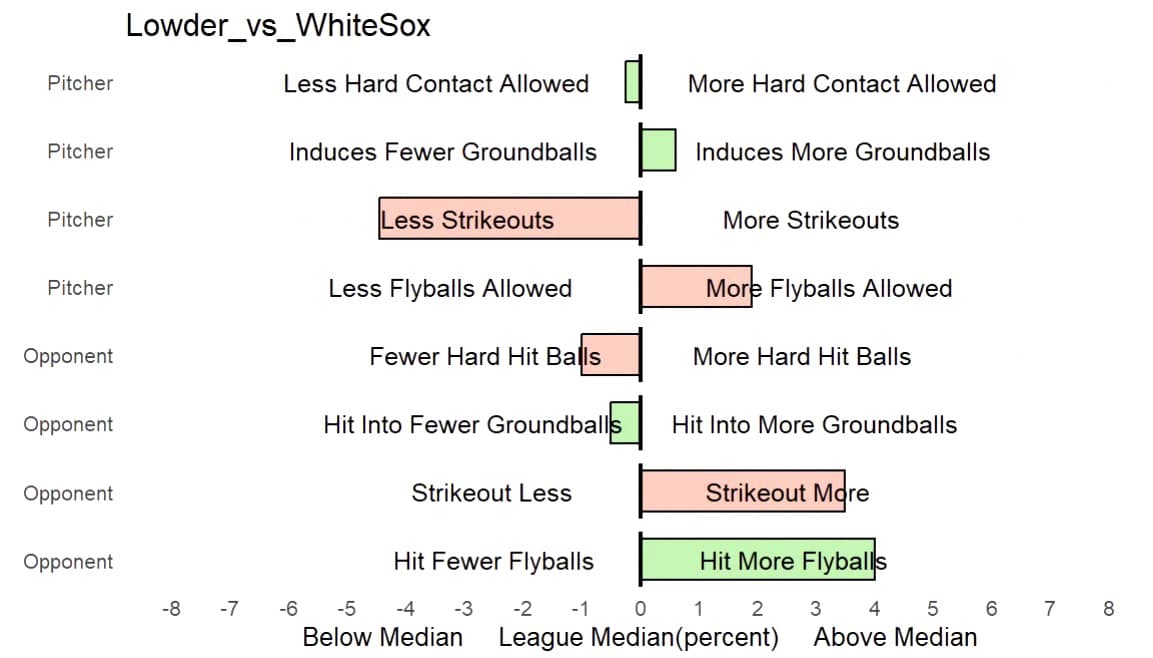
Here, Ranger Suarez does not allow many hard hit balls, at about the league median in groundball rate (thus potential double plays/quick outs), higher strikeouts than league median, and does not allow many flyballs. The Bluejays do not hit the ball hard relative to the league median vs lefties and don't hit into as many groundballs. They strikeout at about the league median and put the ball in the air the most of any team vs lefties (since All-Star break). So green is a positive trait and red is a negative trait for pitcher/team.
Matthews vs. Orioles
Castillo vs. Reds
Miller vs. Yankees
Baz vs. Twins
Leahy vs. Phillies
Suarez vs. Blue Jays
Ray vs. Brewers
Wheeler vs. Cardinals
Soriano vs. Red Sox
Warren vs. Mariners
May vs. Padres
Lowder vs. White Sox
Pitches Thrown / Rest Days
Bullpen ERA by Team
Team WRC+ vs Pitcher Specific Handedness (if starter is R/L)
Pitch Run Value Sum