Friday, July 31st - MLB Matchup Graphs
This article previews some of the matchups for today’s MLB slate.

Richay
MLB & NFL

This article previews some of the matchups for today’s MLB slate.
These graphs should help break down some of the pitching matchups and provide some useful info for your bets. Five games are previewed here. What do all these graphs even mean? I break it down below.
Team stat data is based on performance from June 28 to July 27.
Pitcher data is based on performance throughout the year, minimum 40 innings.
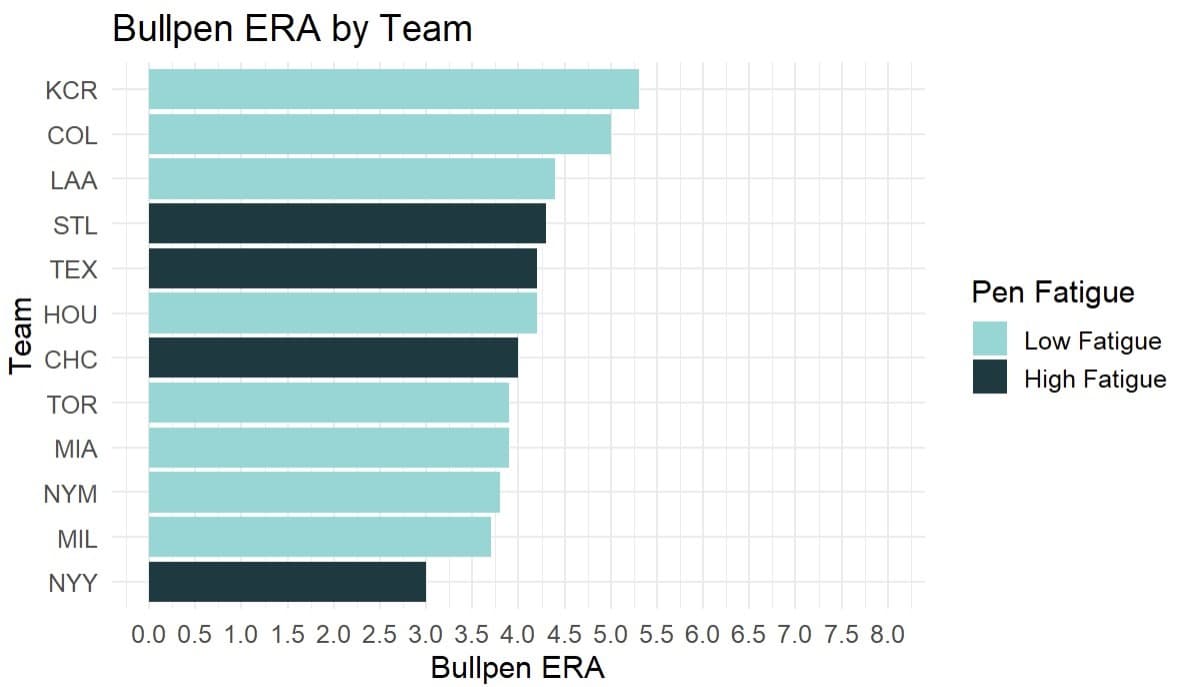
Bullpen ERA is updated daily.
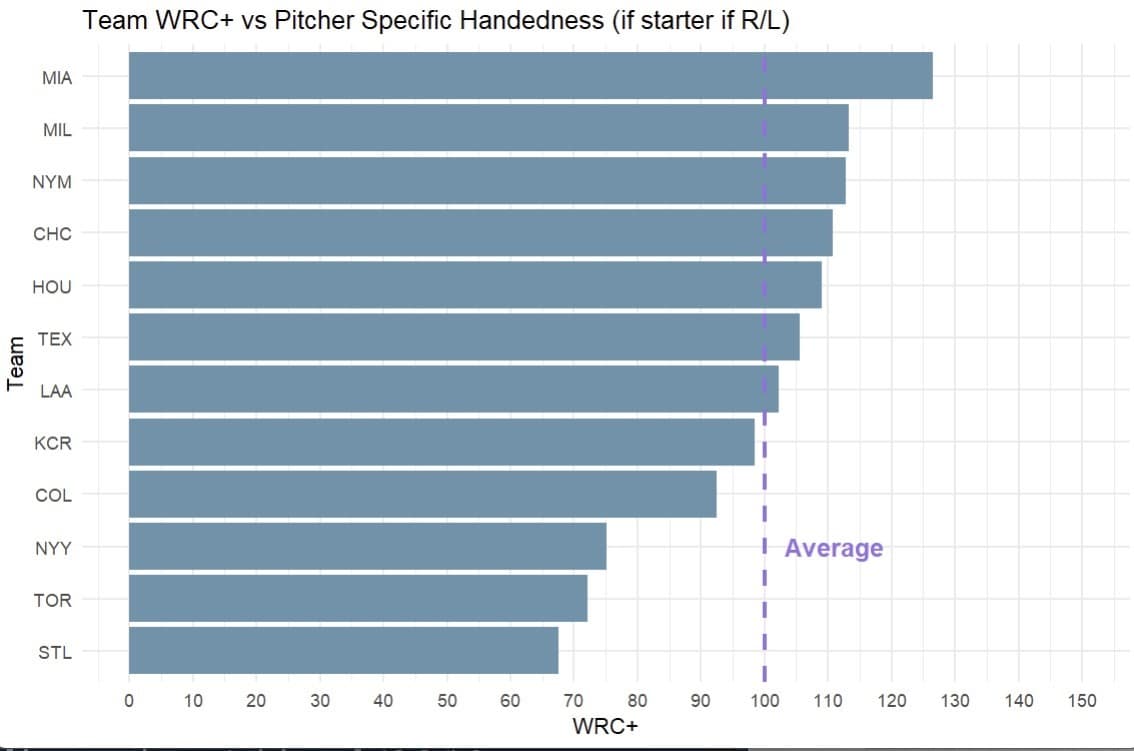
WRC+
What is WRC+? Interpretation: higher values = greater run likelihood. 100 is the league average.
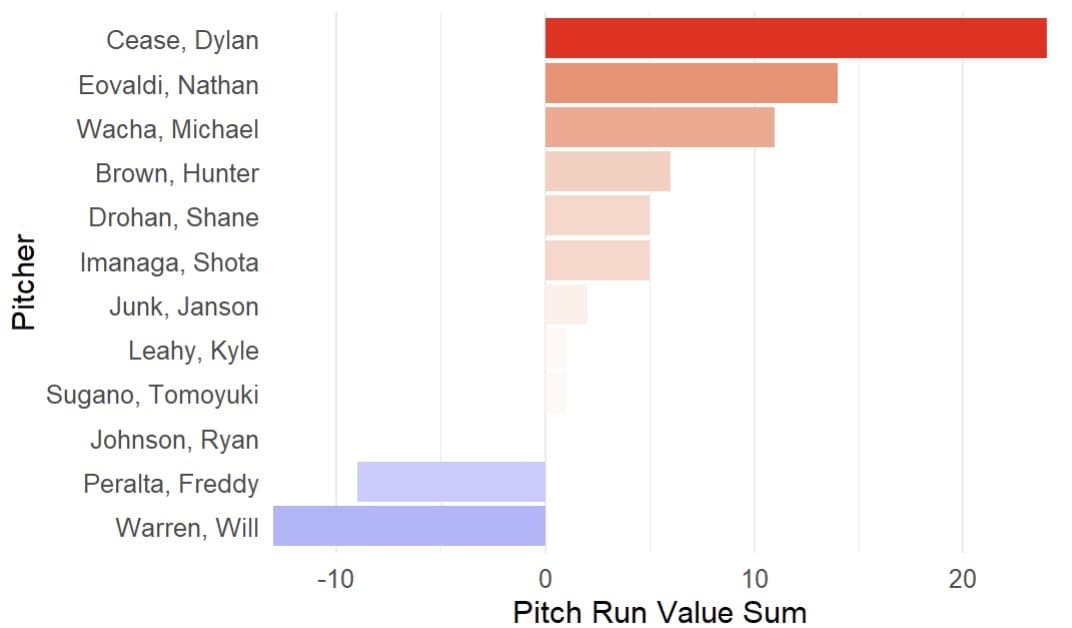
PITCHER RUN VALUES
Higher number means better graded cumulative pitch mix, lower number means worse graded cumulative pitch mix
MATCH-UP GRAPHS
Stats are based on the opposing pitcher’s handedness, meaning, those team stats depend on if the starter is a RHP or LHP. Negative values = below league median, Positive values = above league median for each stat category for the past month.
EXAMPLE:
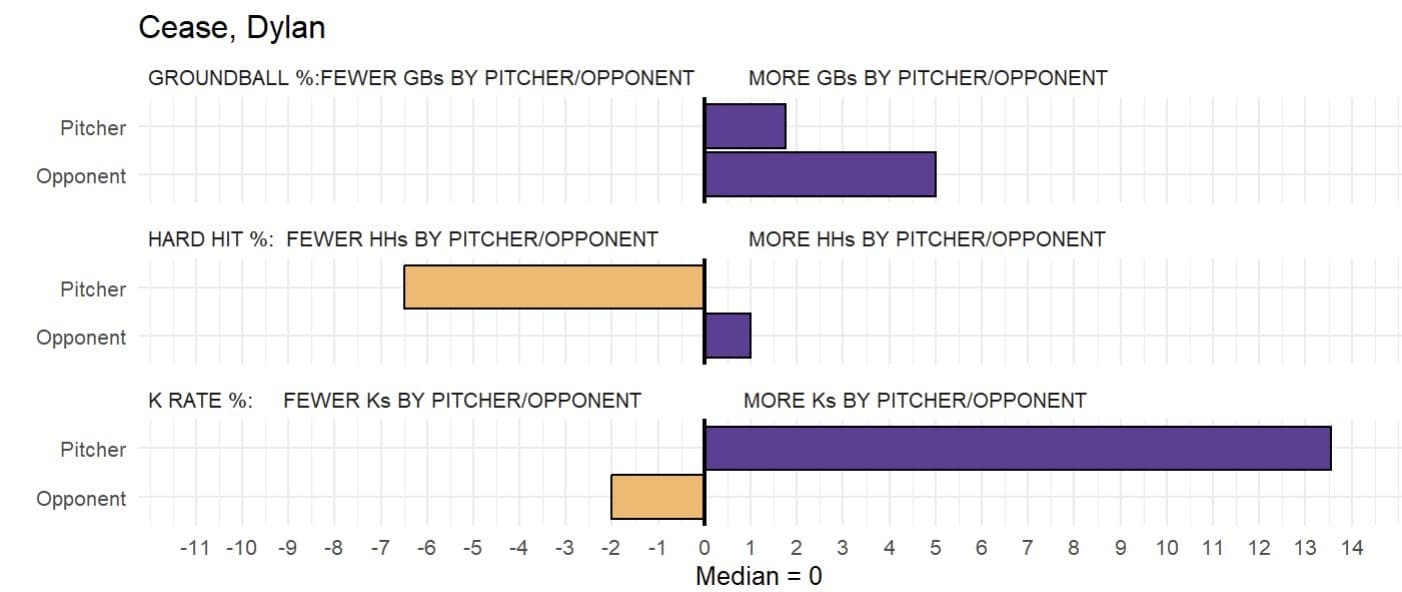
Dylan Cease induces more groundballs, allows fewer hard hits and Ks 13 percent above the league median. Cards hit into more groundballs, have hit slightly harder than the league median and K less than the league median by 2 percent (June 28-July 27).
STL @ TOR
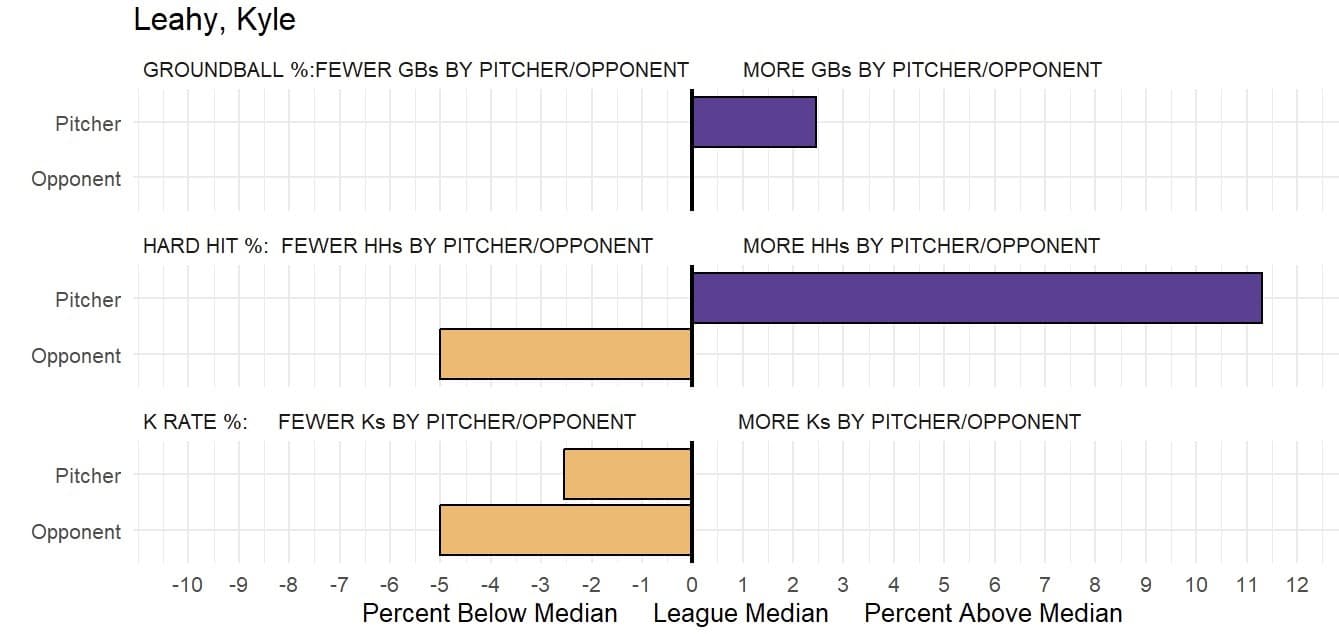
MIA @ NYM
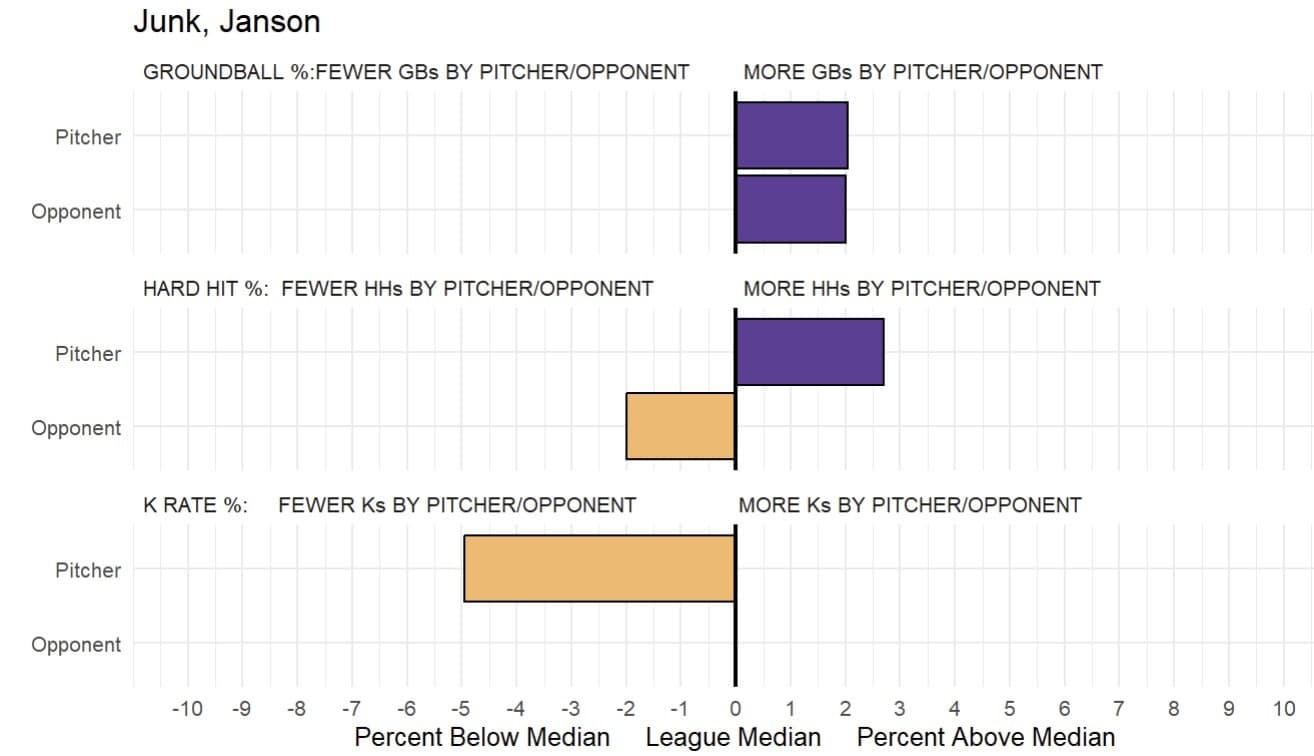
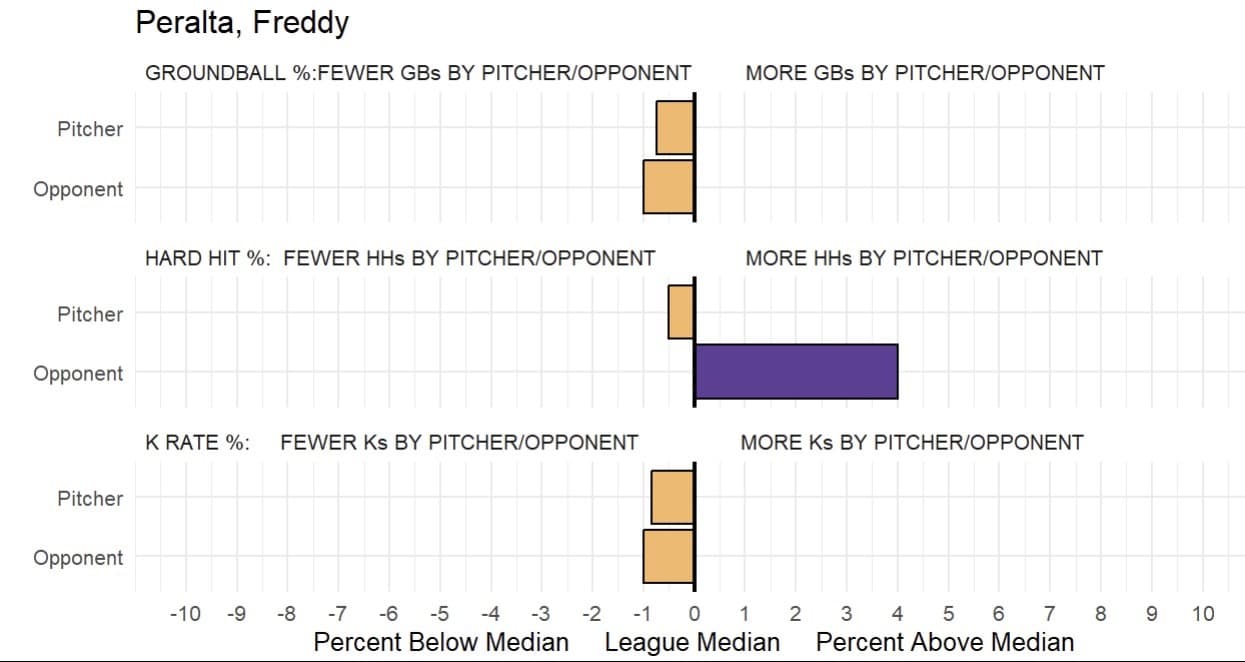
TEX @ HOU
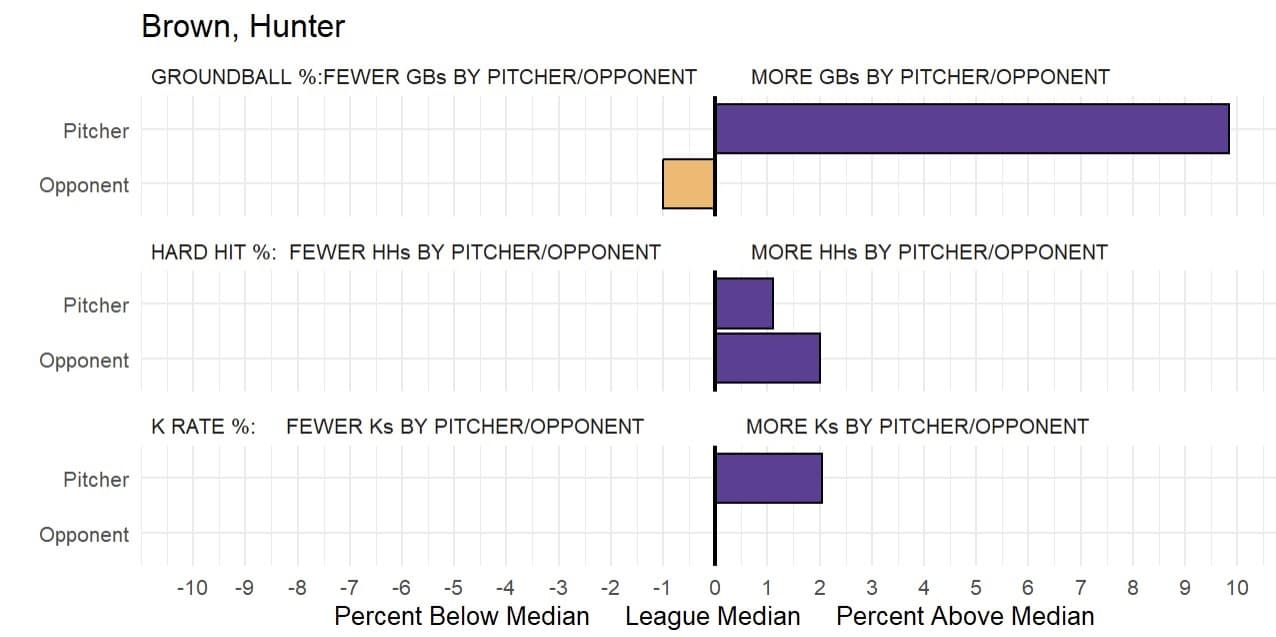
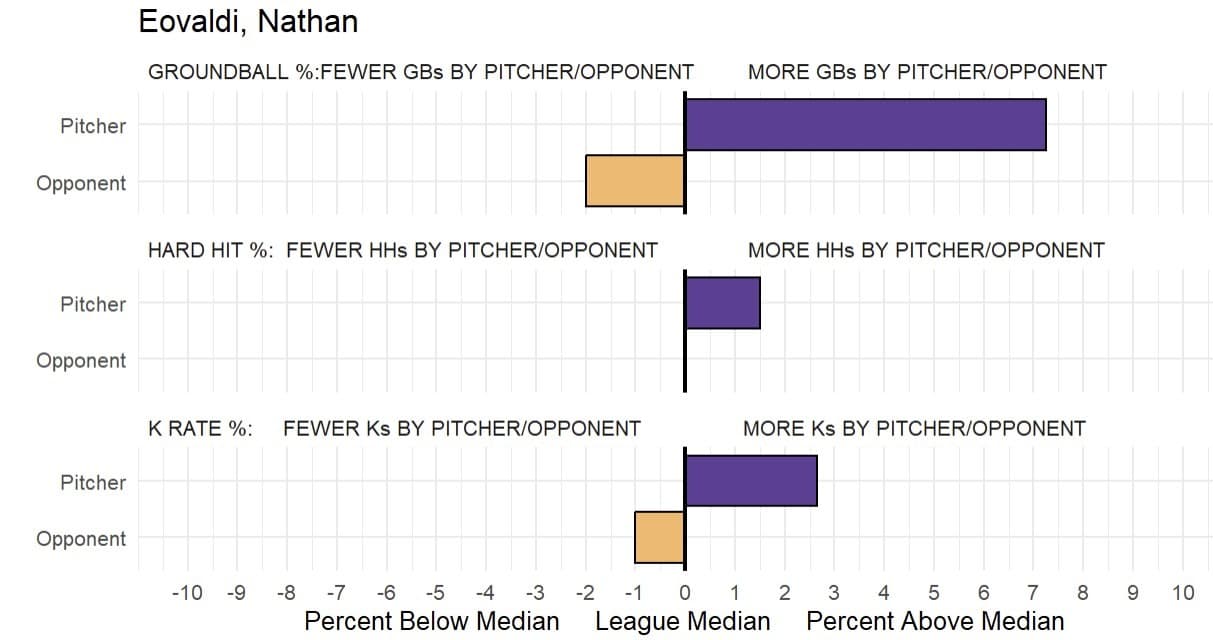
KC @ COL
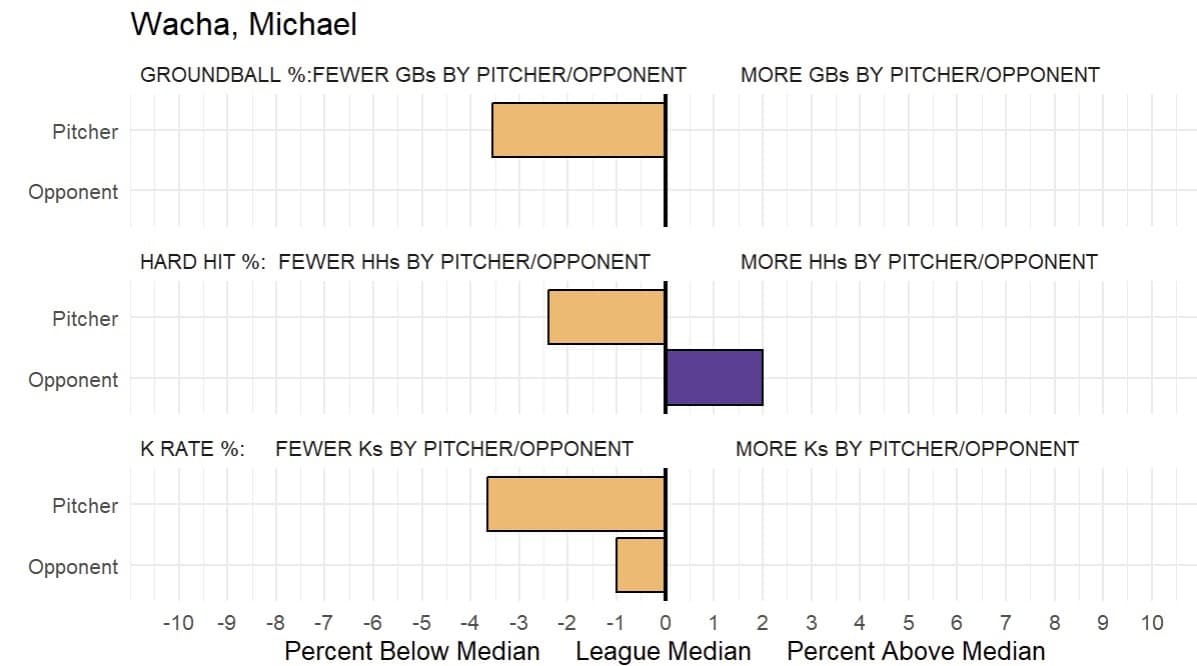
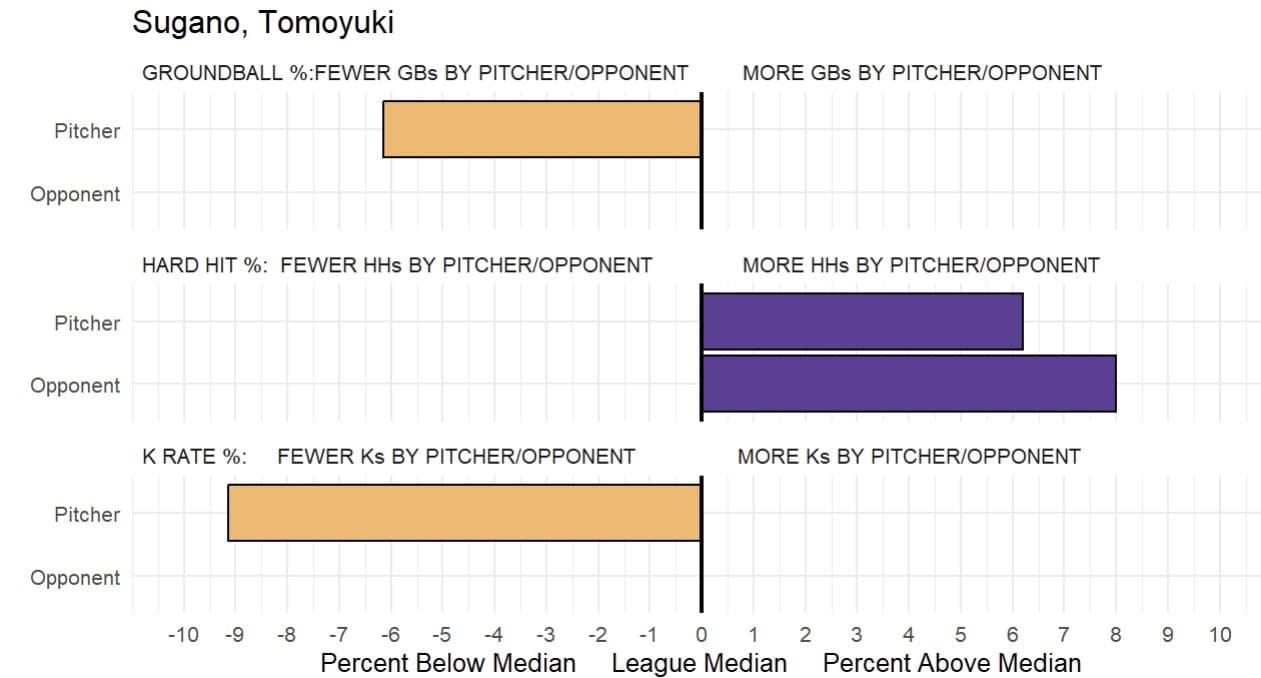
MIL @ LAA
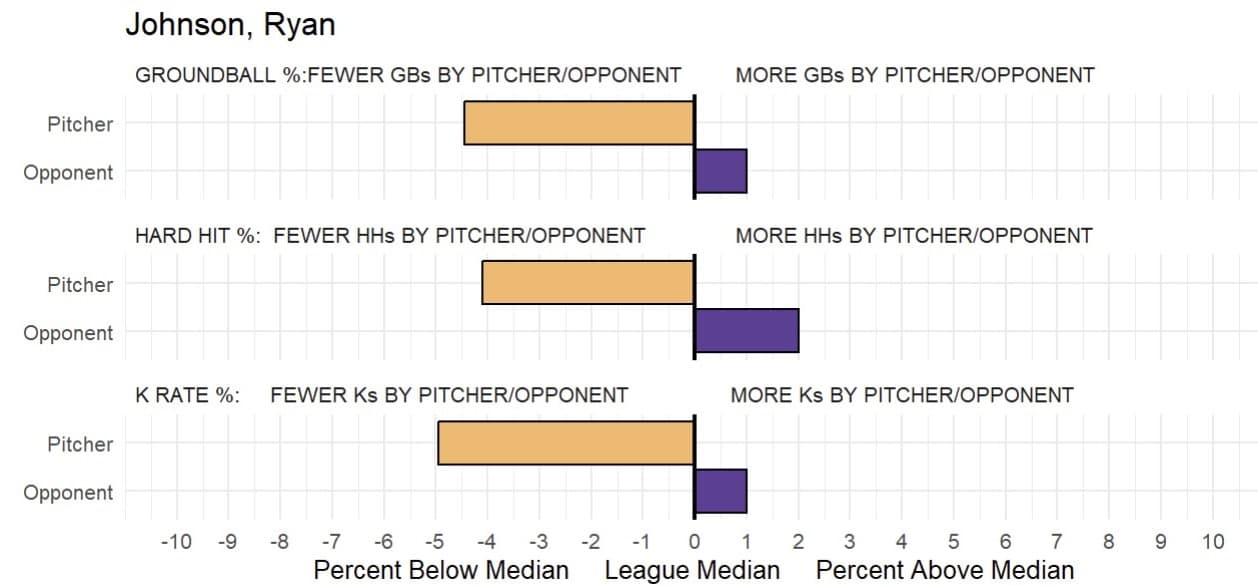
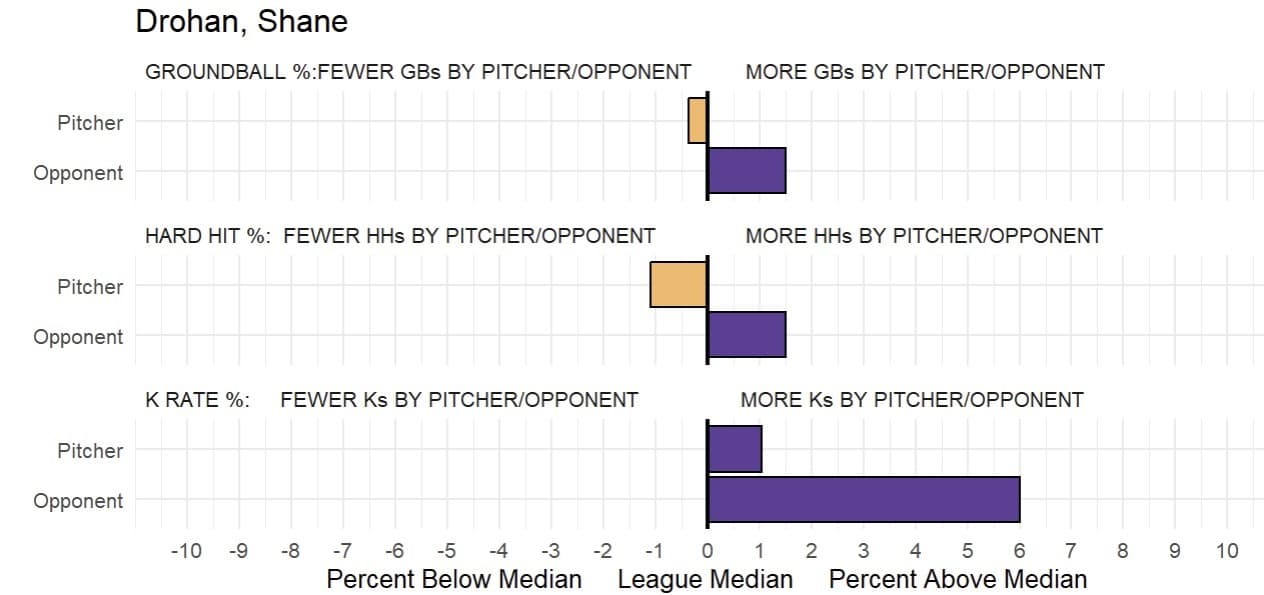
Run Value Sum of Pitcher Arsenals
Bullpen ERA by Team
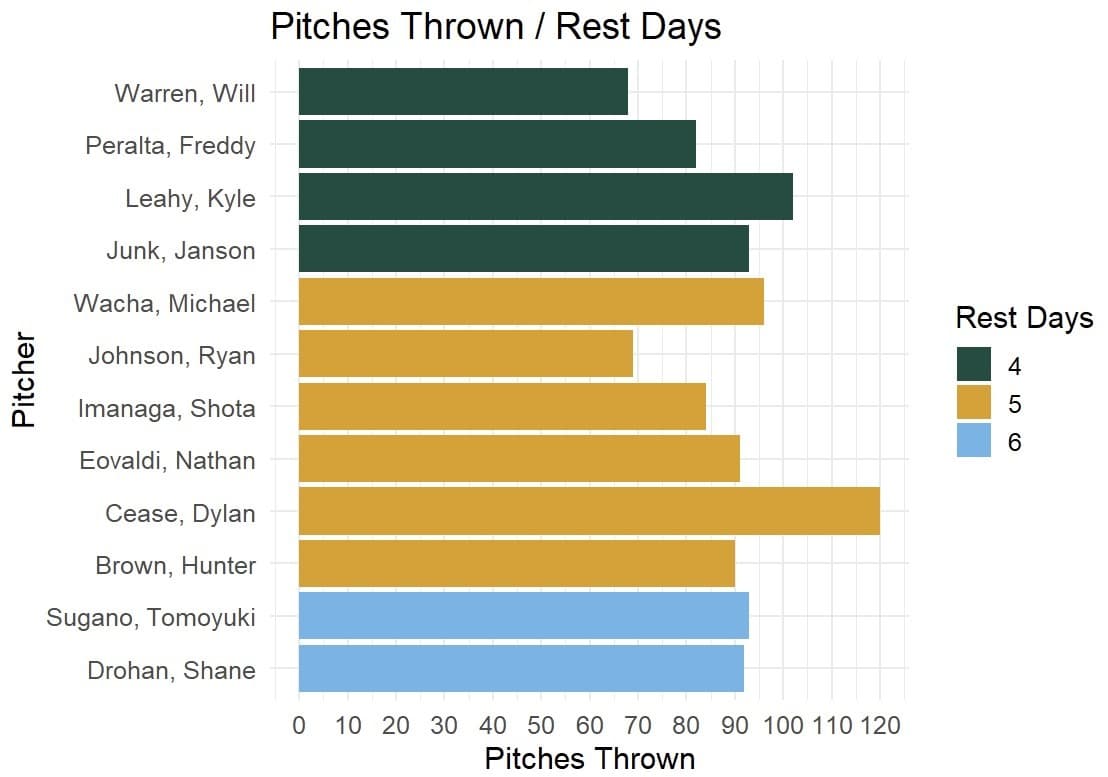
Pitches Thrown / Rest Days
Team WRC+ vs Pitcher Specific Handedness (if starter is R/L)